Tutorial - Part #4 - Image Subtraction
Introduction
For image subtraction the package has a module called operations, which implements a main subtract function to estimate pair-image subtractions.
[1]:
from copy import copy
import numpy as np
import matplotlib.pyplot as plt
import matplotlib.colors as colors

%matplotlib inline
[2]:
from astropy.io.fits import getdata
[3]:
from astropy.visualization import LinearStretch, LogStretch
from astropy.visualization import ZScaleInterval, MinMaxInterval
from astropy.visualization import ImageNormalize
[4]:
palette = copy(plt.cm.gray)
palette.set_bad('r', 0.75)
[5]:
import properimage.single_image as si
from properimage.operations import subtract
[6]:
ref_path = './../../../data/aligned_eso085-030-004.fit'
new_path = './../../../data/aligned_eso085-030-005.fit'
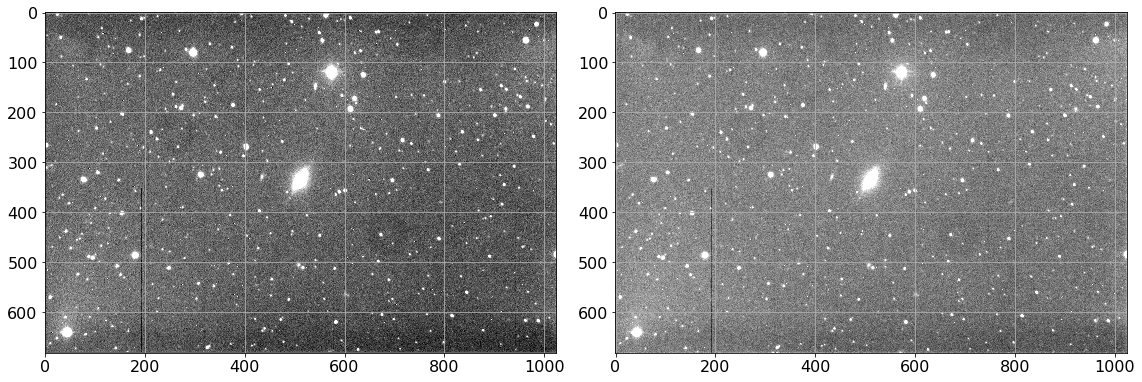
To get the subtraction we need to run this function by using both paths for example:
[7]:
plt.figure(figsize=(16, 12))
plt.subplot(121)
ref = getdata(ref_path)
norm = ImageNormalize(ref, interval=ZScaleInterval(),
                      stretch=LinearStretch())
plt.imshow(ref, cmap=plt.cm.gray, norm=norm, interpolation='none')
plt.tick_params(labelsize=16)
plt.grid()

plt.subplot(122)
ref = getdata(new_path)
norm = ImageNormalize(ref, interval=ZScaleInterval(),
                      stretch=LinearStretch())
plt.imshow(ref, cmap=plt.cm.gray, norm=norm, interpolation='none')
plt.tick_params(labelsize=16)
plt.grid()

plt.tight_layout()
[8]:
%%time

result = subtract(
    ref=ref_path,
    new=new_path,
    smooth_psf=False,
    fitted_psf=True,
    align=False,
    iterative=False,
    beta=False,
    shift=False
)
updating stamp shape to (21,21)
updating stamp shape to (21,21)
CPU times: user 2.58 s, sys: 179 ms, total: 2.76 s
Wall time: 2.83 s
The result is a list of numpy arrays.
The arrays are in order: D, P, Scorr, mask
[9]:
D = result[0]
P = result[1]
Scorr = result[2]
mask = result[3]
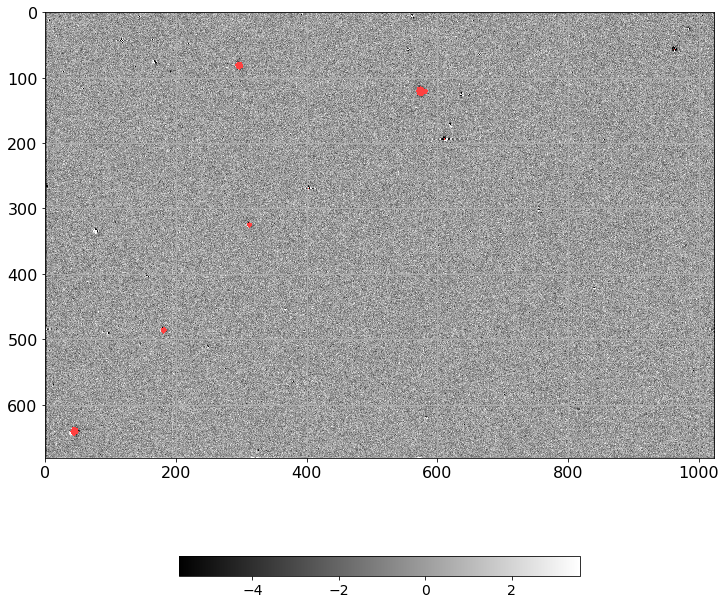
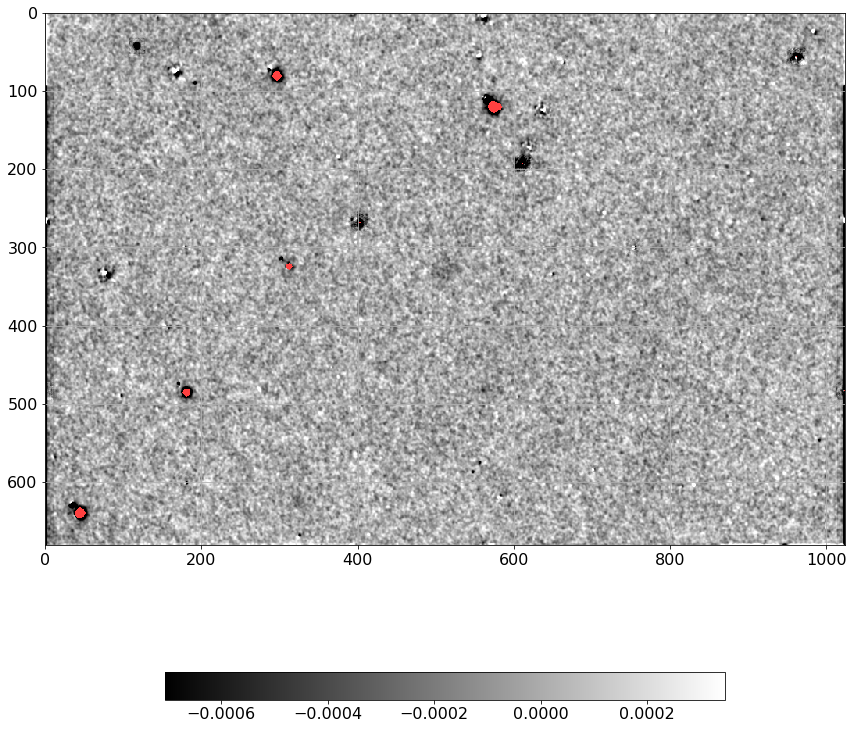
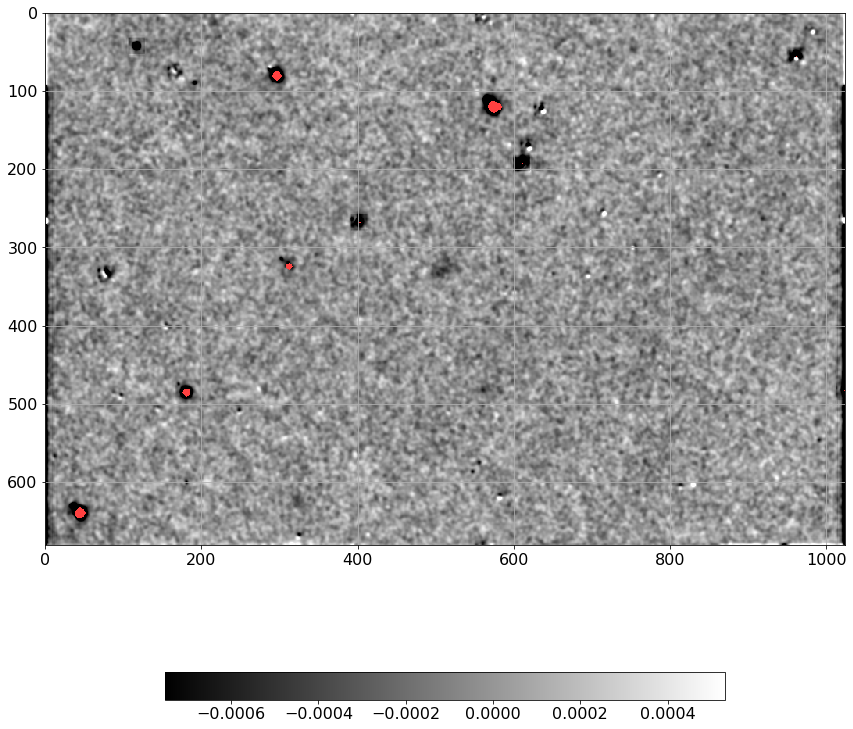
[10]:
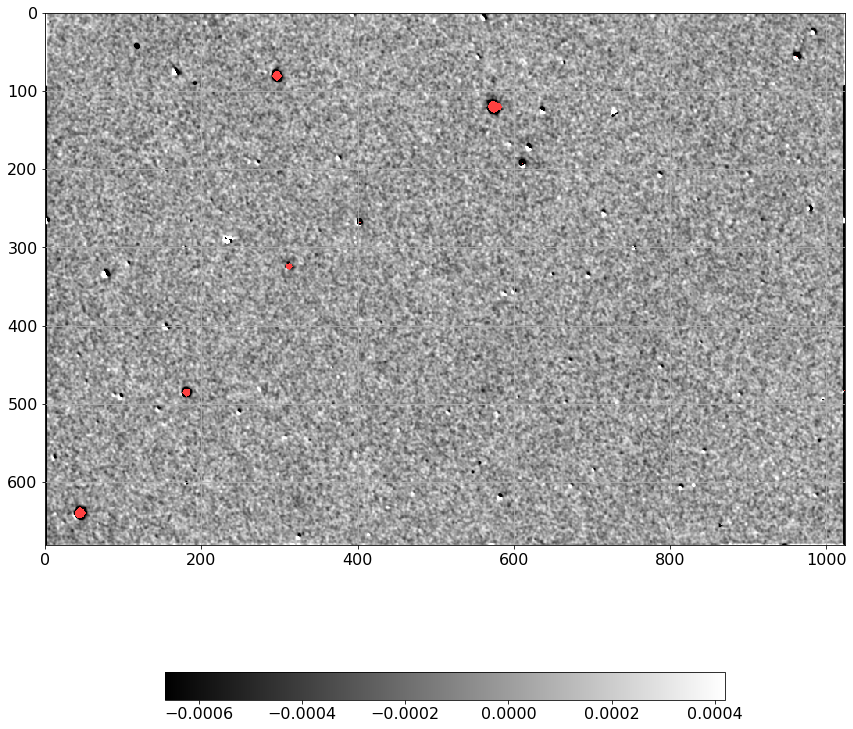
norm = ImageNormalize(D.real, interval=ZScaleInterval(),
                      stretch=LinearStretch())

plt.figure(figsize=(12, 12))
plt.imshow(np.ma.MaskedArray(D.real, mask=mask),
           cmap=palette, norm=norm, interpolation='none')
plt.tick_params(labelsize=16)
plt.grid()
plt.colorbar(orientation='horizontal', shrink=0.6).ax.tick_params(labelsize=14)

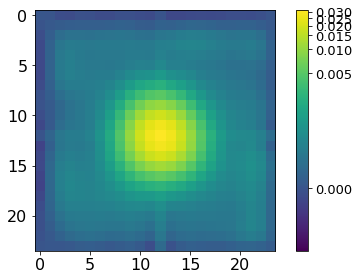
[11]:
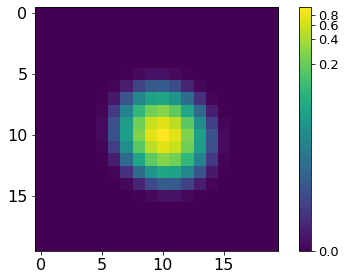
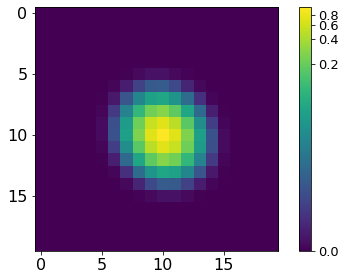
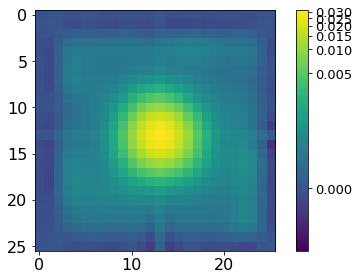
norm = ImageNormalize(P, interval=MinMaxInterval(), stretch=LogStretch())
xc, yc = np.where(P==P.max())
xc, yc = np.round(xc[0]), np.round(yc[0])
plt.imshow(P[xc-10:xc+10, yc-10:yc+10], norm=norm,
           cmap='viridis', interpolation='none')
plt.tick_params(labelsize=16)
plt.colorbar().ax.tick_params(labelsize=13)
plt.tight_layout()
[12]:
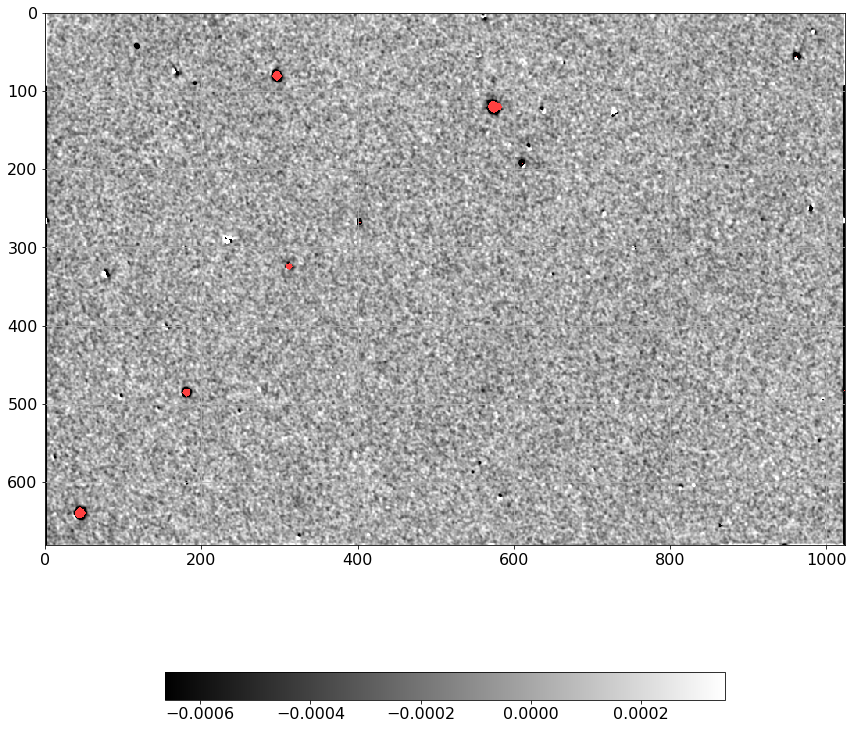
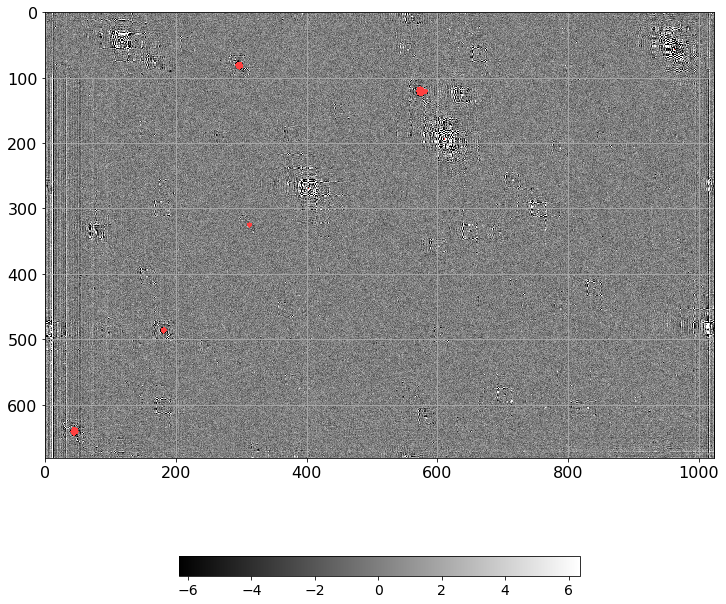
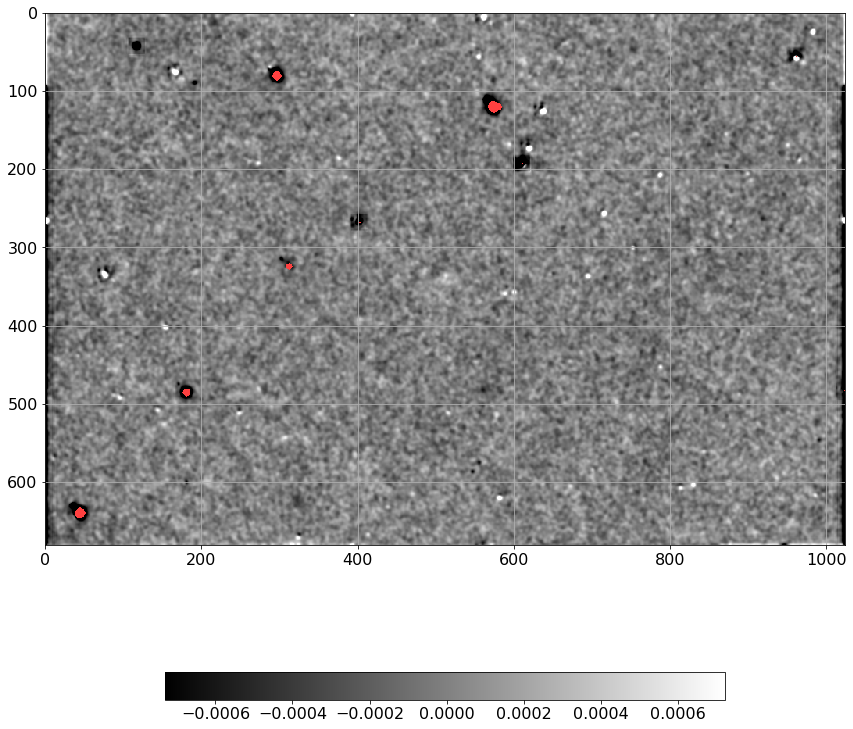
norm = ImageNormalize(Scorr.real, interval=ZScaleInterval(),
                      stretch=LinearStretch())

plt.figure(figsize=(12, 12))
plt.imshow(np.ma.MaskedArray(Scorr.real, mask=mask),
           cmap=palette, norm=norm, interpolation='none')
plt.tick_params(labelsize=16)
plt.colorbar(orientation='horizontal', shrink=0.7).ax.tick_params(labelsize=16)
plt.grid()
plt.tight_layout()
[13]:
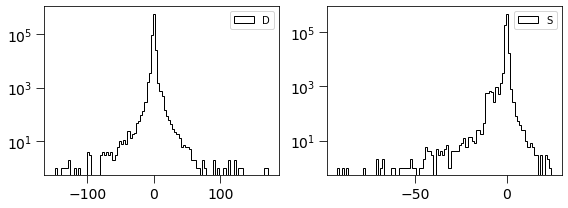
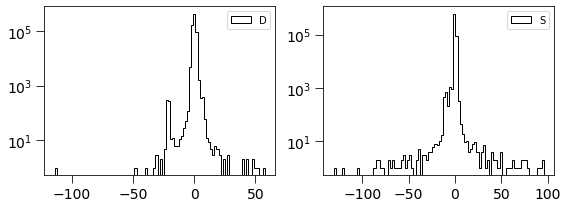
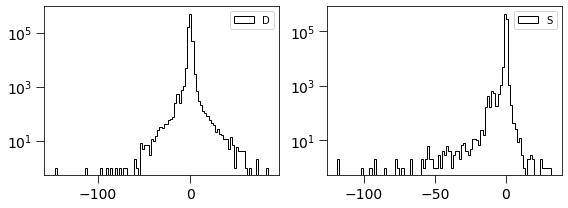
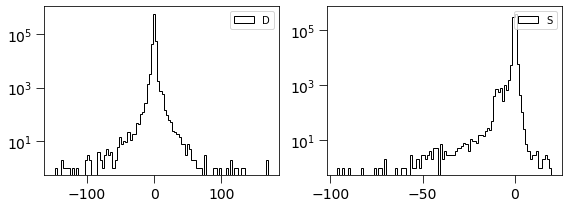
dimg = np.ma.MaskedArray(D.real, mask=mask).filled(0).flatten()
simage = np.ma.MaskedArray(Scorr.real, mask=mask).filled(0).flatten()
[14]:
plt.figure(figsize=(8, 3))

plt.subplot(121)
plt.hist(dimg, log=True, bins=100, histtype='step', label='D', color='k')
plt.legend(loc='best')
plt.tick_params(labelsize=14)
plt.tick_params(size=8)

plt.subplot(122)
plt.hist(simage/np.std(simage), log=True, bins=100, histtype='step', label='S', color='k')
plt.legend(loc='best')
plt.tick_params(labelsize=14)
plt.tick_params(size=8)

plt.tight_layout()
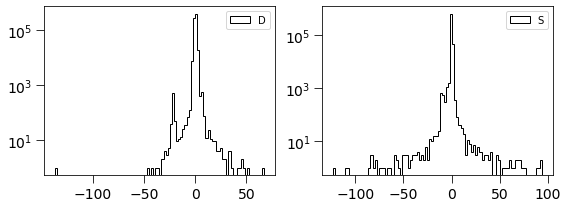
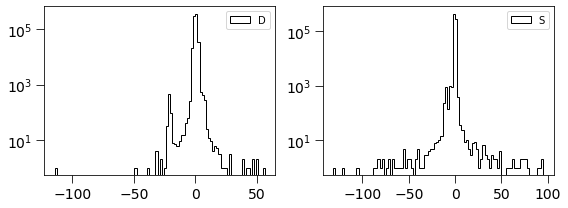
This is related to the quantities derived in Zackay et al. works. \(S_{corr} = P_D \otimes D\)
Different configurations:
We can run the subtraction using different configurations.
This parameters are the following:
align : bool
    Whether to align the images before subtracting, default to False
inf_loss : float
    Value of information loss in PSF estimation, lower limit is 0,
    upper is 1. Only valid if fitted_psf=False. Default is 0.25
smooth_psf : bool
    Whether to smooth the PSF, using a noise reduction technique.
    Default to False.
beta : bool
    Specify if using the relative flux scale estimation.
    Default to True.
shift : bool
    Whether to include a shift parameter in the iterative
    methodology, in order to correct for misalignments.
    Default to True.
iterative : bool
    Specify if an iterative estimation of the subtraction relative
    flux scale must be used. Default to False.
fitted_psf : bool
    Whether to use a Gaussian fitted PSF. Overrides the use of
    auto-psf determination. Default to True.
Example with beta=True, iterative=False
[15]:
%%time

D, P, Scorr, mask = subtract(
    ref=ref_path,
    new=new_path,
    align=False,
    iterative=False,
    beta=True
)
updating stamp shape to (21,21)
updating stamp shape to (21,21)
CPU times: user 7.65 s, sys: 803 ms, total: 8.45 s
Wall time: 8.58 s
[16]:
norm = ImageNormalize(D.real, interval=ZScaleInterval(),
                      stretch=LinearStretch())

plt.figure(figsize=(12, 12))
plt.imshow(np.ma.MaskedArray(D.real, mask=mask),
           cmap=palette, norm=norm, interpolation='none')
plt.tick_params(labelsize=16)
plt.grid()
plt.colorbar(orientation='horizontal', shrink=0.6).ax.tick_params(labelsize=14)
[17]:
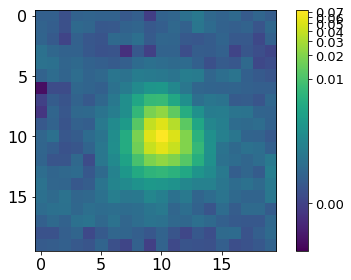
norm = ImageNormalize(P, interval=MinMaxInterval(), stretch=LogStretch())
xc, yc = np.where(P==P.max())
xc, yc = np.round(xc[0]), np.round(yc[0])
plt.imshow(P[xc-10:xc+10, yc-10:yc+10], norm=norm,
           cmap='viridis', interpolation='none')
plt.tick_params(labelsize=16)
plt.colorbar().ax.tick_params(labelsize=13)
plt.tight_layout()

[18]:
norm = ImageNormalize(Scorr.real, interval=ZScaleInterval(),
                      stretch=LinearStretch())

plt.figure(figsize=(12, 12))
plt.imshow(np.ma.MaskedArray(Scorr.real, mask=mask),
           cmap=palette, norm=norm, interpolation='none')
plt.tick_params(labelsize=16)
plt.colorbar(orientation='horizontal', shrink=0.7).ax.tick_params(labelsize=16)
plt.grid()
plt.tight_layout()
[19]:
dimg = np.ma.MaskedArray(D.real, mask=mask).filled(0).flatten()
simage = np.ma.MaskedArray(Scorr.real, mask=mask).filled(0).flatten()
[20]:
plt.figure(figsize=(8, 3))

plt.subplot(121)
plt.hist(dimg, log=True, bins=100, histtype='step', label='D', color='k')
plt.legend(loc='best')
plt.tick_params(labelsize=14)
plt.tick_params(size=8)

plt.subplot(122)
plt.hist(simage/np.std(simage), log=True, bins=100, histtype='step', label='S', color='k')
plt.legend(loc='best')
plt.tick_params(labelsize=14)
plt.tick_params(size=8)

plt.tight_layout()
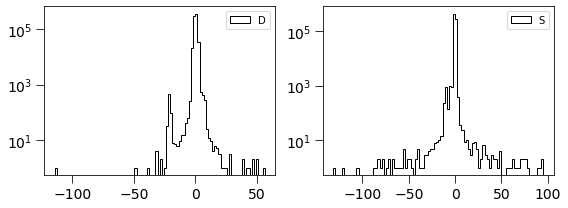
Example with iterative=True but beta=False
[21]:
%%time

D, P, Scorr, mask = subtract(
    ref=ref_path,
    new=new_path,
    align=False,
    iterative=True,
    beta=False
)
updating stamp shape to (21,21)
updating stamp shape to (21,21)
CPU times: user 4.64 s, sys: 363 ms, total: 5.01 s
Wall time: 5.03 s
[22]:
norm = ImageNormalize(D.real, interval=ZScaleInterval(),
                      stretch=LinearStretch())

plt.figure(figsize=(12, 12))
plt.imshow(np.ma.MaskedArray(D.real, mask=mask),
           cmap=palette, norm=norm, interpolation='none')
plt.tick_params(labelsize=16)
plt.grid()
plt.colorbar(orientation='horizontal', shrink=0.6).ax.tick_params(labelsize=14)

[23]:
norm = ImageNormalize(P, interval=MinMaxInterval(), stretch=LogStretch())
xc, yc = np.where(P==P.max())
xc, yc = np.round(xc[0]), np.round(yc[0])
plt.imshow(P[xc-10:xc+10, yc-10:yc+10], norm=norm,
           cmap='viridis', interpolation='none')
plt.tick_params(labelsize=16)
plt.colorbar().ax.tick_params(labelsize=13)
plt.tight_layout()
[24]:
norm = ImageNormalize(Scorr.real, interval=ZScaleInterval(),
                      stretch=LinearStretch())

plt.figure(figsize=(12, 12))
plt.imshow(np.ma.MaskedArray(Scorr.real, mask=mask),
           cmap=palette, norm=norm, interpolation='none')
plt.tick_params(labelsize=16)
plt.colorbar(orientation='horizontal', shrink=0.7).ax.tick_params(labelsize=16)
plt.grid()
plt.tight_layout()

[25]:
dimg = np.ma.MaskedArray(D.real, mask=mask).filled(0).flatten()
simage = np.ma.MaskedArray(Scorr.real, mask=mask).filled(0).flatten()
[26]:
plt.figure(figsize=(8, 3))

plt.subplot(121)
plt.hist(dimg, log=True, bins=100, histtype='step', label='D', color='k')
plt.legend(loc='best')
plt.tick_params(labelsize=14)
plt.tick_params(size=8)

plt.subplot(122)
plt.hist(simage/np.std(simage), log=True, bins=100, histtype='step', label='S', color='k')
plt.legend(loc='best')
plt.tick_params(labelsize=14)
plt.tick_params(size=8)

plt.tight_layout()
Example with iterative=True and beta=True
[27]:
%%time

D, P, Scorr, mask = subtract(
    ref=ref_path,
    new=new_path,
    smooth_psf=False,
    fitted_psf=True,
    align=False,
    iterative=True,
    beta=True,
    shift=True
)
updating stamp shape to (21,21)
updating stamp shape to (21,21)
CPU times: user 7.85 s, sys: 951 ms, total: 8.8 s
Wall time: 9.36 s
The result is a list of numpy arrays.
The arrays are in order: D, P, Scorr, mask
[28]:
norm = ImageNormalize(D.real, interval=ZScaleInterval(),
                      stretch=LinearStretch())

plt.figure(figsize=(12, 12))
plt.imshow(np.ma.MaskedArray(D.real, mask=mask),
           cmap=palette, norm=norm, interpolation='none')
plt.tick_params(labelsize=16)
plt.grid()
plt.colorbar(orientation='horizontal', shrink=0.6).ax.tick_params(labelsize=14)

[29]:
norm = ImageNormalize(P, interval=MinMaxInterval(), stretch=LogStretch())
xc, yc = np.where(P==P.max())
xc, yc = np.round(xc[0]), np.round(yc[0])
plt.imshow(P[xc-10:xc+10, yc-10:yc+10], norm=norm,
           cmap='viridis', interpolation='none')
plt.tick_params(labelsize=16)
plt.colorbar().ax.tick_params(labelsize=13)
plt.tight_layout()

[30]:
norm = ImageNormalize(Scorr.real, interval=ZScaleInterval(),
                      stretch=LinearStretch())

plt.figure(figsize=(12, 12))
plt.imshow(np.ma.MaskedArray(Scorr.real, mask=mask),
           cmap=palette, norm=norm, interpolation='none')
plt.tick_params(labelsize=16)
plt.colorbar(orientation='horizontal', shrink=0.7).ax.tick_params(labelsize=16)
plt.grid()
plt.tight_layout()

[31]:
dimg = np.ma.MaskedArray(D.real, mask=mask).filled(0).flatten()
simage = np.ma.MaskedArray(Scorr.real, mask=mask).filled(0).flatten()
[32]:
plt.figure(figsize=(8, 3))

plt.subplot(121)
plt.hist(dimg, log=True, bins=100, histtype='step', label='D', color='k')
plt.legend(loc='best')
plt.tick_params(labelsize=14)
plt.tick_params(size=8)

plt.subplot(122)
plt.hist(simage/np.std(simage), log=True, bins=100, histtype='step', label='S', color='k')
plt.legend(loc='best')
plt.tick_params(labelsize=14)
plt.tick_params(size=8)

plt.tight_layout()
Example with fitted_psf=False and beta=True
[33]:
%%time

D, P, Scorr, mask = subtract(
    ref=ref_path,
    new=new_path,
    smooth_psf=False,
    fitted_psf=False,
    align=False,
    iterative=False,
    beta=True,
    shift=True
)
updating stamp shape to (21,21)
updating stamp shape to (21,21)
CPU times: user 8.91 s, sys: 1.03 s, total: 9.93 s
Wall time: 10 s
The result is a list of numpy arrays.
The arrays are in order: D, P, Scorr, mask
[34]:
norm = ImageNormalize(D.real, interval=ZScaleInterval(),
                      stretch=LinearStretch())

plt.figure(figsize=(12, 12))
plt.imshow(np.ma.MaskedArray(D.real, mask=mask),
           cmap=palette, norm=norm, interpolation='none')
plt.tick_params(labelsize=16)
plt.grid()
plt.colorbar(orientation='horizontal', shrink=0.6).ax.tick_params(labelsize=14)

[35]:
norm = ImageNormalize(P, interval=MinMaxInterval(), stretch=LogStretch())
xc, yc = np.where(P==P.max())
xc, yc = np.round(xc[0]), np.round(yc[0])
plt.imshow(P[xc-10:xc+10, yc-10:yc+10], norm=norm,
           cmap='viridis', interpolation='none')
plt.tick_params(labelsize=16)
plt.colorbar().ax.tick_params(labelsize=13)
plt.tight_layout()
[36]:
norm = ImageNormalize(Scorr.real, interval=ZScaleInterval(),
                      stretch=LinearStretch())

plt.figure(figsize=(12, 12))
plt.imshow(np.ma.MaskedArray(Scorr.real, mask=mask),
           cmap=palette, norm=norm, interpolation='none')
plt.tick_params(labelsize=16)
plt.colorbar(orientation='horizontal', shrink=0.7).ax.tick_params(labelsize=16)
plt.grid()
plt.tight_layout()
[37]:
dimg = np.ma.MaskedArray(D.real, mask=mask).filled(0).flatten()
simage = np.ma.MaskedArray(Scorr.real, mask=mask).filled(0).flatten()
[38]:
plt.figure(figsize=(8, 3))

plt.subplot(121)
plt.hist(dimg, log=True, bins=100, histtype='step', label='D', color='k')
plt.legend(loc='best')
plt.tick_params(labelsize=14)
plt.tick_params(size=8)

plt.subplot(122)
plt.hist(simage/np.std(simage), log=True, bins=100, histtype='step', label='S', color='k')
plt.legend(loc='best')
plt.tick_params(labelsize=14)
plt.tick_params(size=8)

plt.tight_layout()
Example with smooth_psf=True and fitted_psf=False, using beta=True, iterative=True.
[39]:
%%time

D, P, Scorr, mask = subtract(
    ref=ref_path,
    new=new_path,
    smooth_psf=True,
    fitted_psf=False,
    align=False,
    iterative=True,
    beta=True,
    shift=True
)
updating stamp shape to (21,21)
updating stamp shape to (21,21)
CPU times: user 6.53 s, sys: 782 ms, total: 7.31 s
Wall time: 7.47 s
The result is a list of numpy arrays.
The arrays are in order: D, P, Scorr, mask
[40]:
norm = ImageNormalize(D.real, interval=ZScaleInterval(),
                      stretch=LinearStretch())

plt.figure(figsize=(12, 12))
plt.imshow(np.ma.MaskedArray(D.real, mask=mask),
           cmap=palette, norm=norm, interpolation='none')
plt.tick_params(labelsize=16)
plt.grid()
plt.colorbar(orientation='horizontal', shrink=0.6).ax.tick_params(labelsize=14)
[41]:
norm = ImageNormalize(P, interval=MinMaxInterval(), stretch=LogStretch())
xc, yc = np.where(P==P.max())
xc, yc = np.round(xc[0]), np.round(yc[0])
plt.imshow(P[xc-13:xc+13, yc-13:yc+13], norm=norm,
           cmap='viridis', interpolation='none')
plt.tick_params(labelsize=16)
plt.colorbar().ax.tick_params(labelsize=13)
plt.tight_layout()
[42]:
norm = ImageNormalize(Scorr.real, interval=ZScaleInterval(),
                      stretch=LinearStretch())

plt.figure(figsize=(12, 12))
plt.imshow(np.ma.MaskedArray(Scorr.real, mask=mask),
           cmap=palette, norm=norm, interpolation='none')
plt.tick_params(labelsize=16)
plt.colorbar(orientation='horizontal', shrink=0.7).ax.tick_params(labelsize=16)
plt.grid()
plt.tight_layout()
[43]:
dimg = np.ma.MaskedArray(D.real, mask=mask).filled(0).flatten()
simage = np.ma.MaskedArray(Scorr.real, mask=mask).filled(0).flatten()
[44]:
plt.figure(figsize=(8, 3))

plt.subplot(121)
plt.hist(dimg, log=True, bins=100, histtype='step', label='D', color='k')
plt.legend(loc='best')
plt.tick_params(labelsize=14)
plt.tick_params(size=8)

plt.subplot(122)
plt.hist(simage/np.std(simage), log=True, bins=100, histtype='step', label='S', color='k')
plt.legend(loc='best')
plt.tick_params(labelsize=14)
plt.tick_params(size=8)

plt.tight_layout()
Example with smooth_psf=True and fitted_psf=False, using beta=False, iterative=False.
[45]:
%%time

D, P, Scorr, mask = subtract(
    ref=ref_path,
    new=new_path,
    smooth_psf=True,
    fitted_psf=False,
    align=False,
    iterative=False,
    beta=False,
    shift=True
)
updating stamp shape to (21,21)
updating stamp shape to (21,21)
CPU times: user 5.12 s, sys: 495 ms, total: 5.62 s
Wall time: 5.73 s
The result is a list of numpy arrays.
The arrays are in order: D, P, Scorr, mask
[46]:
norm = ImageNormalize(D.real, interval=ZScaleInterval(),
                      stretch=LinearStretch())

plt.figure(figsize=(12, 12))
plt.imshow(np.ma.MaskedArray(D.real, mask=mask),
           cmap=palette, norm=norm, interpolation='none')
plt.tick_params(labelsize=16)
plt.grid()
plt.colorbar(orientation='horizontal', shrink=0.6).ax.tick_params(labelsize=14)

[47]:
norm = ImageNormalize(P, interval=MinMaxInterval(), stretch=LogStretch())
xc, yc = np.where(P==P.max())
xc, yc = np.round(xc[0]), np.round(yc[0])
plt.imshow(P[xc-12:xc+12, yc-12:yc+12], norm=norm,
           cmap='viridis', interpolation='none')
plt.tick_params(labelsize=16)
plt.colorbar().ax.tick_params(labelsize=13)
plt.tight_layout()
[48]:
norm = ImageNormalize(Scorr.real, interval=ZScaleInterval(),
                      stretch=LinearStretch())

plt.figure(figsize=(12, 12))
plt.imshow(np.ma.MaskedArray(Scorr.real, mask=mask),
           cmap=palette, norm=norm, interpolation='none')
plt.tick_params(labelsize=16)
plt.colorbar(orientation='horizontal', shrink=0.7).ax.tick_params(labelsize=16)
plt.grid()
plt.tight_layout()
[49]:
dimg = np.ma.MaskedArray(D.real, mask=mask).filled(0).flatten()
simage = np.ma.MaskedArray(Scorr.real, mask=mask).filled(0).flatten()
[50]:
plt.figure(figsize=(8, 3))

plt.subplot(121)
plt.hist(dimg, log=True, bins=100, histtype='step', label='D', color='k')
plt.legend(loc='best')
plt.tick_params(labelsize=14)
plt.tick_params(size=8)

plt.subplot(122)
plt.hist(simage/np.std(simage), log=True, bins=100, histtype='step', label='S', color='k')
plt.legend(loc='best')
plt.tick_params(labelsize=14)
plt.tick_params(size=8)

plt.tight_layout()